This article is part of a series. Please refer to the Addendum article (https://alamedaclarion.com/2020/02/05/ausd-2020-measure-c-addendum) for additional notes. Inline notes that reference the Addendum will signify this with the label Addm.X where X is the number in the Addendum.
Summary
- This is an Analysis article about the Alameda Unified School District (AUSD).
- Alameda has a lot of neighborhood schools for its size, and small class sizes. Many people consider this a positive aspect of living here.
- But this also creates a higher cost structure since we need to staff these extra schools with teachers, librarians and other professionals.
- And because our primary funding is proportionate to our number of students, the district has more people to pay with the same dollars. One inevitable outcome is lower average pay.
Although Charm Can Grow on Trees
The first time I came to Alameda, my impression was that it was very quaint. The combination of old houses, tree-lined streets and small, neighborhood business districts give Alameda the feel of a small town. With a video rental store, independent movie theater and a by-the-scoop ice cream store almost on the same block, it sometimes feels like a place out of time.
Alameda’s schools add to its quaintness. We have a total of 21 schools in the district (including charter schools) of which 10 are elementary schools. Alameda has a total area of a little over 10 square miles1 of which a big portion is the old base, meaning there’s a good chance that any given home has an elementary school less than a mile away. Being able to walk their kids to school is an aspect of Alameda that many people feel strongly about.

But there is a cost to this. Alameda has a lot of schools for its size. On the basis of our enrollment, we have one of the highest numbers of schools in the county. In Figure 12 we see that only Oakland and Newark have fewer students per school. It’s important to note that this is a very crude measure and lacks some important nuance, but it hints that one of the reasons we have less money for teachers is that we have to support more infrastructure per student, while our number of students is the biggest driver of how much funding we get3. That makes it hard to live within our means.

We see this reflected in our school staffing, which is the primary cost driver in a school district4. Let’s first look at the labor cost that is held to be most dear in this current election: teachers. Figure 2 shows that Alameda has an average of 19 students enrolled per full-time equivalent teacher (FTE). The county average as shown by the horizontal line is a little over 20 students5. This seems like a small difference but there are over 11000 students enrolled in the AUSD. By rough figuring, if we reduced the ratio to the county average we would reduce our FTE by about 30. If we take AUSD’s salary plus health cost number of about $78,000, this would be savings of about $2.34M or enough to give the remaining teachers an average raise of $4142 per year6.
That’s almost half way to the roughly $9000 needed to bring Alameda teachers to the county average based on AUSD numbers7. But teachers aren’t the only cost center: school districts employ an array of professionals who keep the schools running. Let’s look at two that are specifically called out in department of education statistics: certificated administrators and pupil services staff.

Figure 3 shows the ratio of enrolled students to certificated administrators. Certificated administrators are staff that, like teachers, have a recognized certification but who aren’t providing teaching services directly to students. They include jobs like principals and coordinators. Alameda comes well below the average of about 274 students per administrator8.
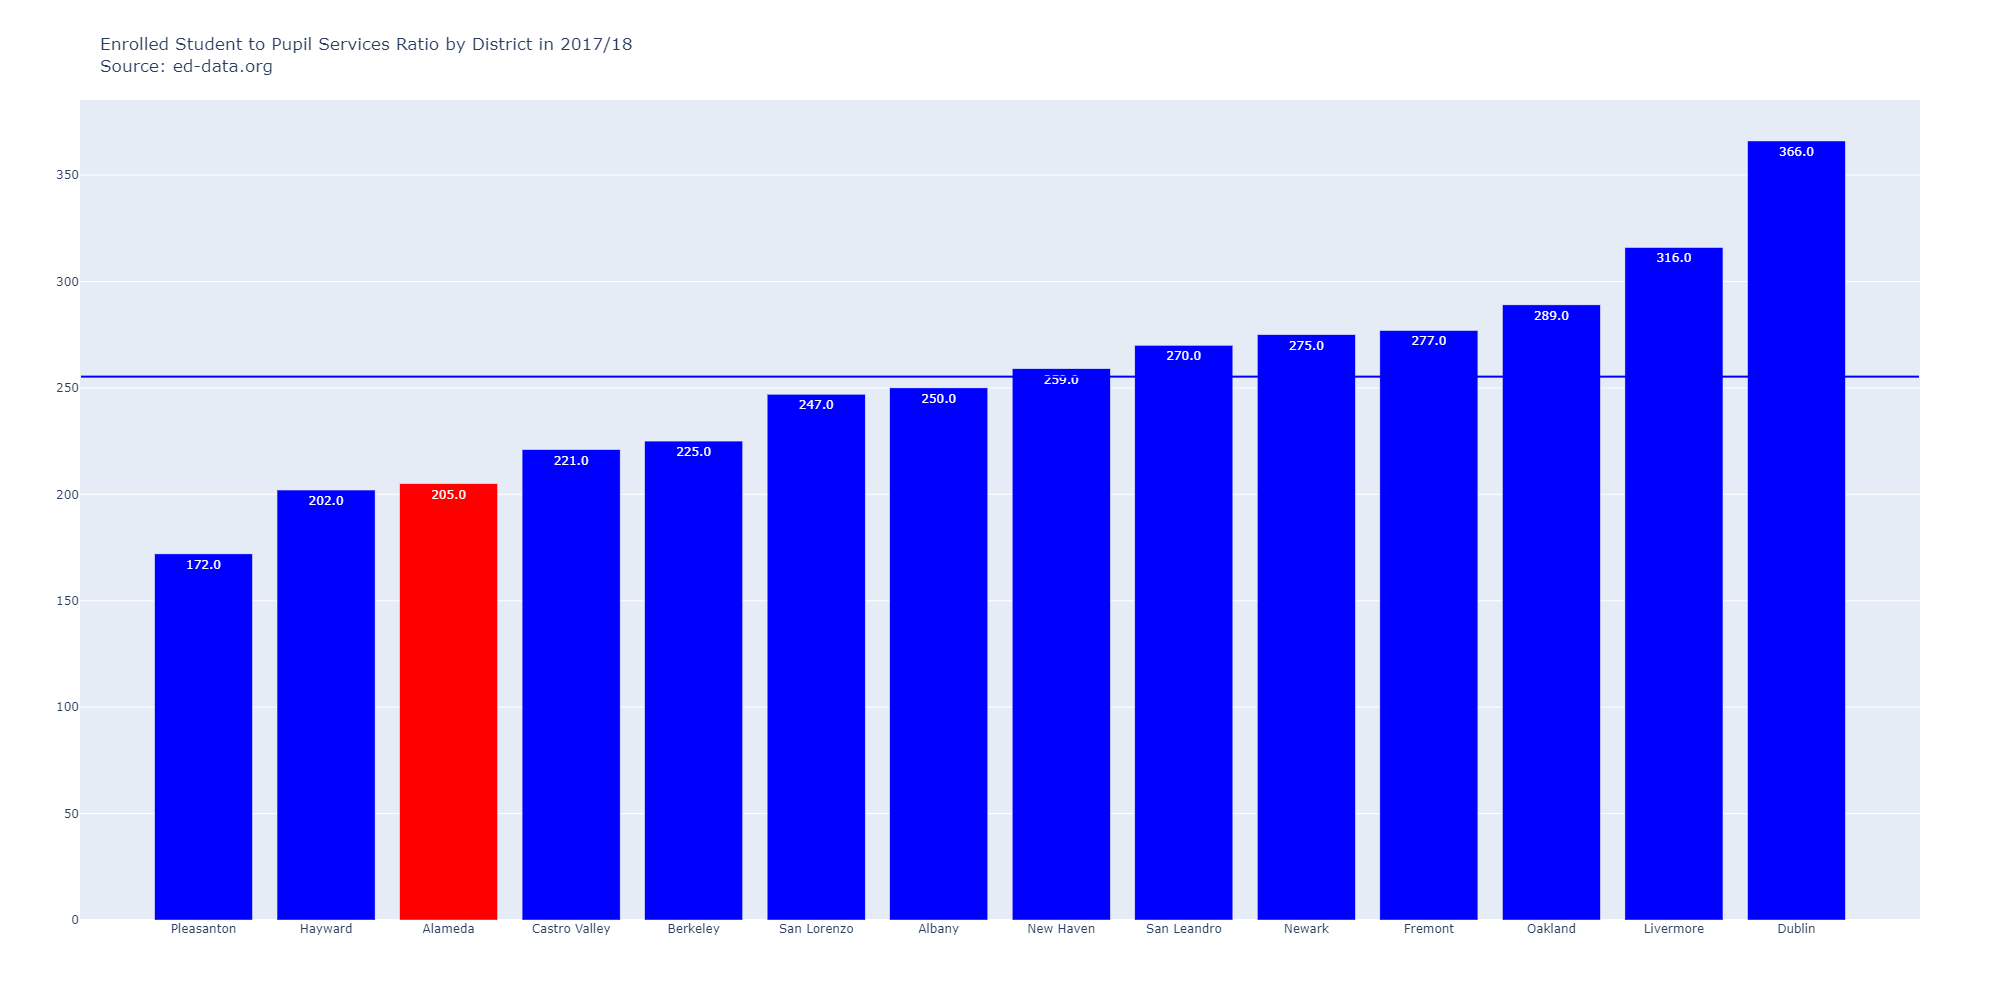
Figure 4 shows the ratio of enrolled students to pupil services staff. Pupil Services staff are those people we all remember from school, who provide services to students but aren’t teachers, like nurses, librarians and counselors. Alameda is again well below the average of 255 students per pupil service employee8.
I don’t have solid numbers (yet) on what an average staff member in each of these categories costs the district to employ but let’s say they make $50,000 per year. This is probably a low estimate since we are including professions like nursing and school principals who are often better paid than that. If we were to again reduce our workforce to the average in each of these categories we would find a savings of about $850,000. So our total savings is now $3.2M or enough to give our 565 FTE teachers a total raise of $5646. Now we’re at over half of the $9000 we need and we haven’t even considered regular office and maintenance staff9.
Conclusion
Of course, this is a very superficial way to do budget analysis, but it demonstrates why having more schools for our number of students makes things more costly: each school needs it’s own nurses and librarians and so on, and the resulting smaller class sizes mean we need more teachers. Our funding is tied to the number of students we have, so each dollar gets stretched across more salaried workers; it should be unsurprising that to make the math work, we have lower salaries.
In my next article, I will get more rigorous by comparing the district’s categorized costs to that of others.
Footnotes
- See under “Area”: https://en.wikipedia.org/wiki/Alameda,_California (Accessed Feb 19, 2020).
- Until this article I have used “ADA” (see Addm.1) per student denominated ratios. ed-data.org uses enrollment instead for ratios involving staffing. I think this is because different districts account for charter school enrollment differently. For consistency, I have followed their convention. Note that Enrollment is almost always larger than ADA.
- See my previous article, https://alamedaclarion.com/2020/02/12/how-our-school-district-is-funded/
- AUSD spent $87M of $110M in general fund expenditure on salaries and benefits in 2017/18 according to ed-data.org. This is normal if you look at other districts.
- The numbers I’m using from ed-data.org are suspiciously rounded whole numbers but I’m only looking for rough numbers here anyway.
- Conservatively, current enrollment at 11,299 / 19 = ~595 FTE. Reducing the ratio to 11,299 / 20 gives 565 or a reduction in about 30 FTE. $78000 times 30 = $2.34M and $2.34M divided by 565 = $4142.
- See my previous article, https://alamedaclarion.com/2020/02/05/why-does-alameda-underpay-its-teachers/
- According to ed-data.org.
- For administrators 11,299 / 241 = ~47 and 11,299 / 274 = ~41 for 6 reduced headcount. For pupil services 11,299 / 205 = 55 and 11,299 / 255 = ~44 for 11 reduced headcount. So combined we have 17 less head count times our $50,000 estimated cost makes $850,000.
